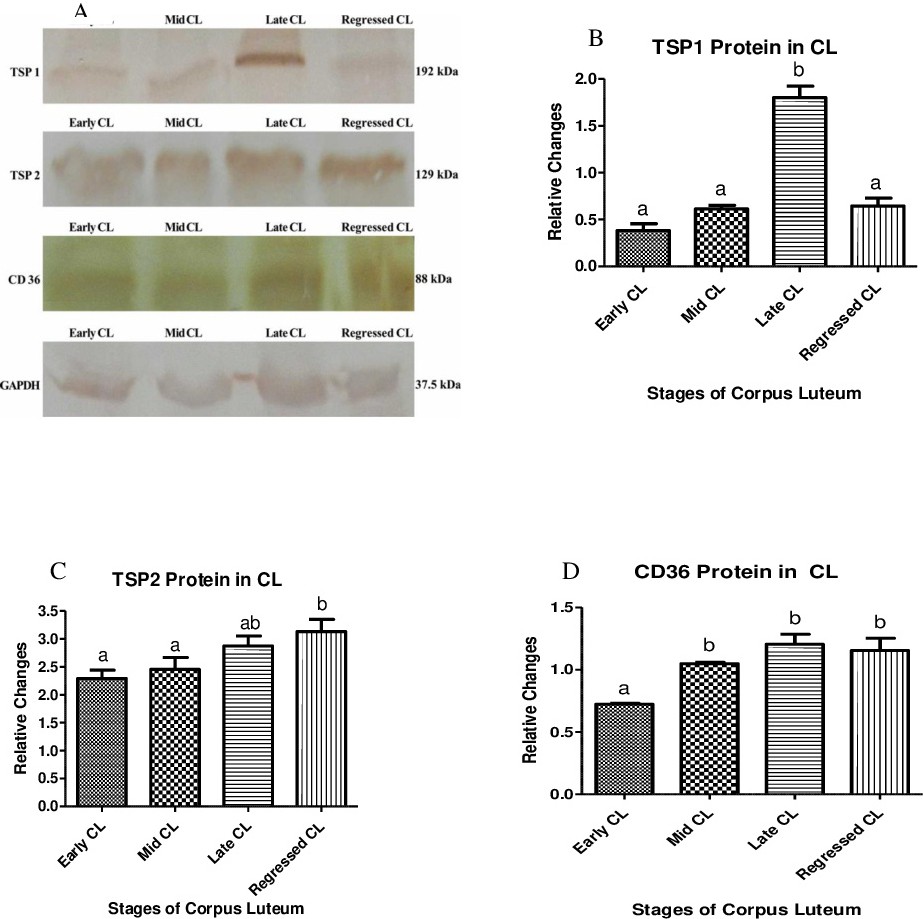
Fig. 2. Demonstration of (A) representative blots of TSP1, TSP2, CD36 and GAPDH by immunoblotting at different stages of CL development in the riverine buffalo. The relative molecular weight of each protein is shown along the right side of each blot. The luteal proteins were loaded @ 100 mg/ well and resolved in 10% SDS-PAGE followed by electrotransfer to a PVDF membrane. Protein specific antibodies were used @ 1:500 while secondary antibody @1:2000 dilutions. GAPDH was used as reference protein. Relative expression of TSP and its receptors was analysed by densitometry using image J software (n = 6/group). One-way ANOVA to determine if treatment groups were significantly different. Tukey HSD test was done to find the pair-wise mean differences. Each bar represents Mean ± SEM. Different superscripts denote statistical significance (p<0.05). Abbreviations: CL, Corpus Luteum; TSP, Thrombospondin; CD, Cluster of differentiation.